When Should I Ride Pirates of the Caribbean?

I have long had an obsession with data. Just the idea of having to collect vast amounts of data to plot a graph gets me jumping with excitment. Using data I can potentially learn something that has never been known before. How can such an incredible opportunity not excite you to your very core?
Another obsession I maintain concerns theme parks, in particular any form of Disney theme park. I am known for my efficient fun-having at parks, optimising each day for maximum potential fun with effectively scheduled ride orders and regular "ad-lib" time slots when the parks will be too busy to do pretty much anything. I keep an eye on park activities using a custom Android app I built so I can view the information that's important to me at a glance, and it is built to minimise mobile traffic, as all the parks I wish to visit are abroad and roaming mobile data speeds are the top of my first-world-problems list.
So can I combine these obsessions to both satisfy my hunger for data, and my determination for ruthless efficency of theme park fun?
Yes, of course I can.
I've decided to focus on one of my favourite rides, Pirates of the Caribbean.
Step 1: Data
First we need to collect the data.
I've been recording wait times for major theme parks since around mid-January. This data set holds a bunch of data, such as the ride wait time, and the current local time at the park.
I'm using my own (plug) NodeJS library to collect the data, called themeparks. It is used by lots of the major theme park planning websites, and generally my favourite side project, as it keeps me clued in with the happenings of all the world's theme parks.
It is worth noting that all this data is based on the times Disney publish, which is not neccessarily the same as the "real wait times". Disney will always round up wait times to the nearest 5 minutes, and likely manipulate the times through predictions, or based on general expected ride popularity due to guest counts to give the best estimate possible. Because of this, the wait times are never truly the actual wait times, but the official times are usually fairly accurate, so they will have to do (and it's all we've got!).
Data is collected once every 5 minutes, and stored in a set of (currently 17GB) text files, to be imported into databases/spreadsheets when ready to be consumed and analysed.
Running this for just over 5 months gave me over 18,000 data points for each ride.
For fun, let's plot these immediately onto a graph!
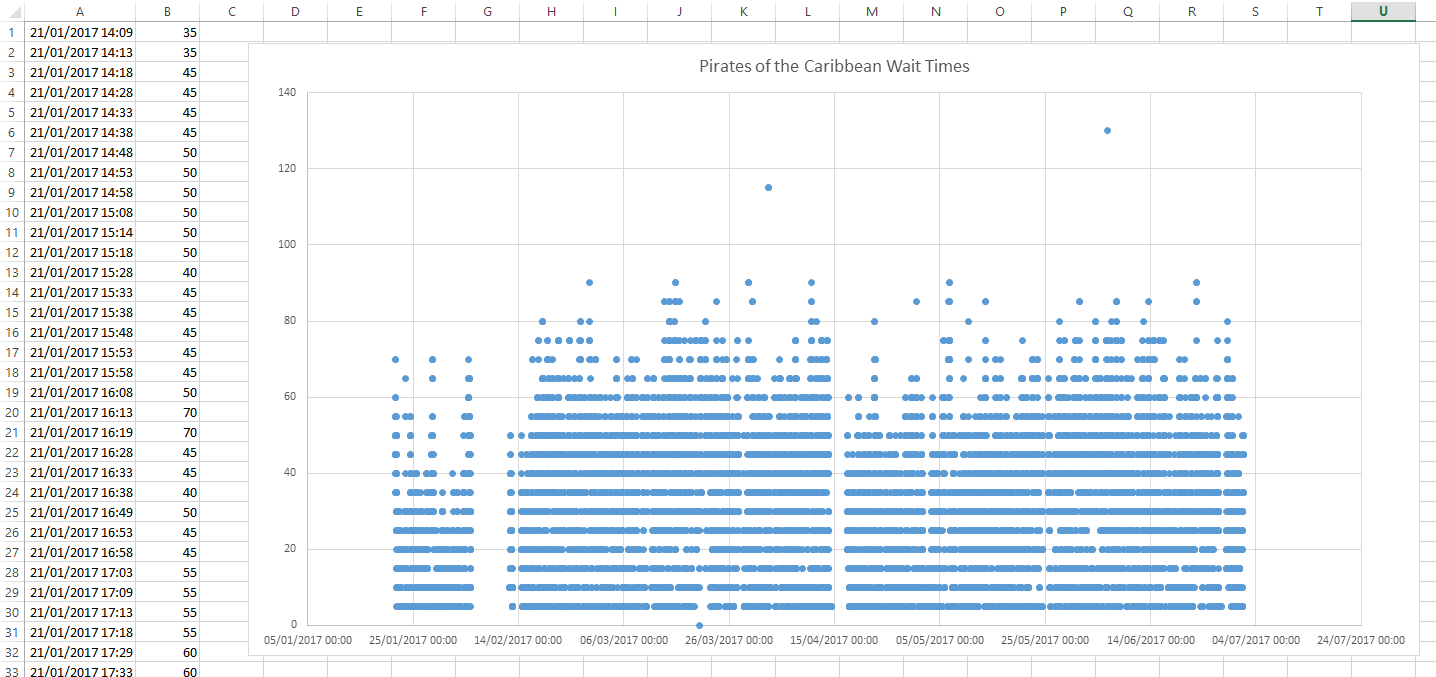
It's always important to look at the raw data in the worst possible light first. Here I can see there are two large gaps, which are from when my machine went offline unexpectedly when:
- I went on holiday to New York
- I went on holiday to the South West of England
So other than my computer's habit of switching off as soon as I move more than 5 miles away from it (which I have now resolved), I can see there is a great amount of data over a reasonable period of time (and I'm still collecting, so hopefully will get even better results in the future!)
Another interesting observation is that there is a single data-point (9:05 in the morning on March 20th 2017) when the ride was not only open, but had a zero-minute queue. At no other time did I collect a zero wait time result. I expect that maybe during the first 5 minutes the wait times for rides probably update from 0 -> 5 minutes relatively quickly, and the 5 minute recording may not be regular enough to catch this (and any more regular than this is also not needed, as the wait times do not change that frequently).
Step 2: To Excel!
Ideally, this data should be being fed into a time-series database like Influx (and that's the plan). But before I start automating all the data analysis, I want to do some manually to see what works and what doesn't.
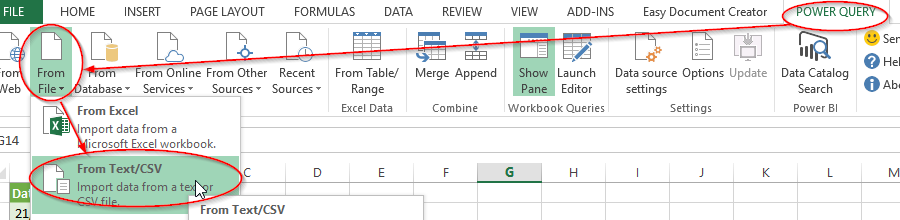
First step was to take our CSV and import it into Excel. Rather than copy/paste the data into a XLSX sheet, I'm using a plugin called "POWER QUERY", that lets you have sheets containing data from a remote source. I'm using this with my pirates.csv file to be able to dynamically update the spreadsheet with source data whenever I get a new CSV with more data in it.
You can download Power Query here.
I have also uploaded the CSV file I'm using, for reference. pirates.csv
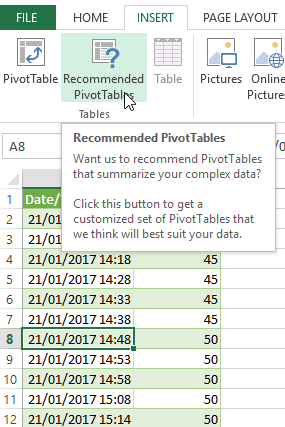
Now the data is in Excel, let's pivot table it!
Click inside the table, and goto Insert -> Recommend PivotTables
You want to choose the first column as your row, and the second column as your value. Change the value calculation by right-clicking it to be "Average".
Now we can do things like group our data by hour or month (or both!) to start getting some information...
Step 3: ???
Fiddling with the data is a great joy. If we right-click the first row we can group the data by different date/time attributes. If we group by Hour, this will give us the average wait times per day, which looks a bit like this:
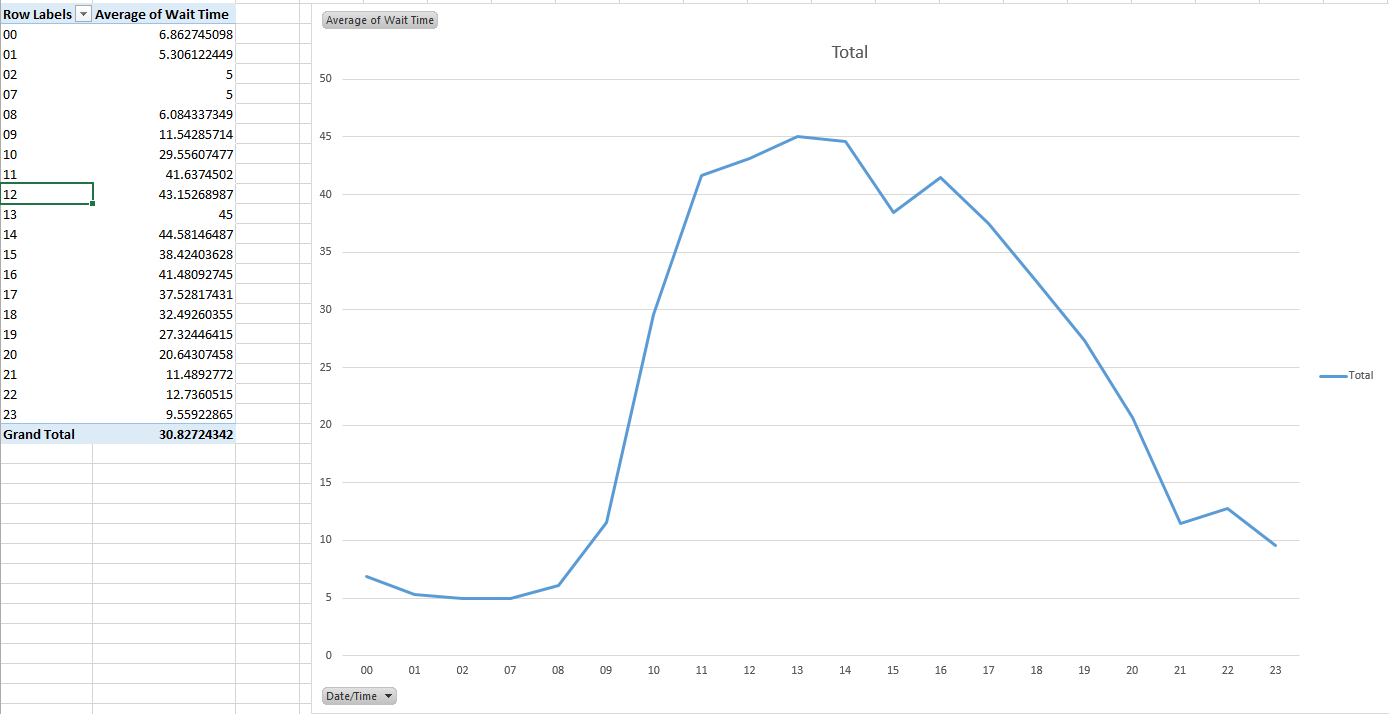
There is a lovely dip around 15:00, which we could probably attribute to a mix of lunchtime and there often being a parade about to start around this time.
We also have data from around 1-2 in the morning, averaging a pretty flat 5 minute wait time. This will be from the Extra Magic Hours the park offers, where it will occasionally stay open past midnight (there are also other ticketed events where the park stays open very late). This confirms that staying as late as humanly possible guarantees you'll basically be able to walk-on to even the most popular attractions.
However, don't lose hope just yet. I can also plot the average alongside the minimum and maximum time recorded for each hour:
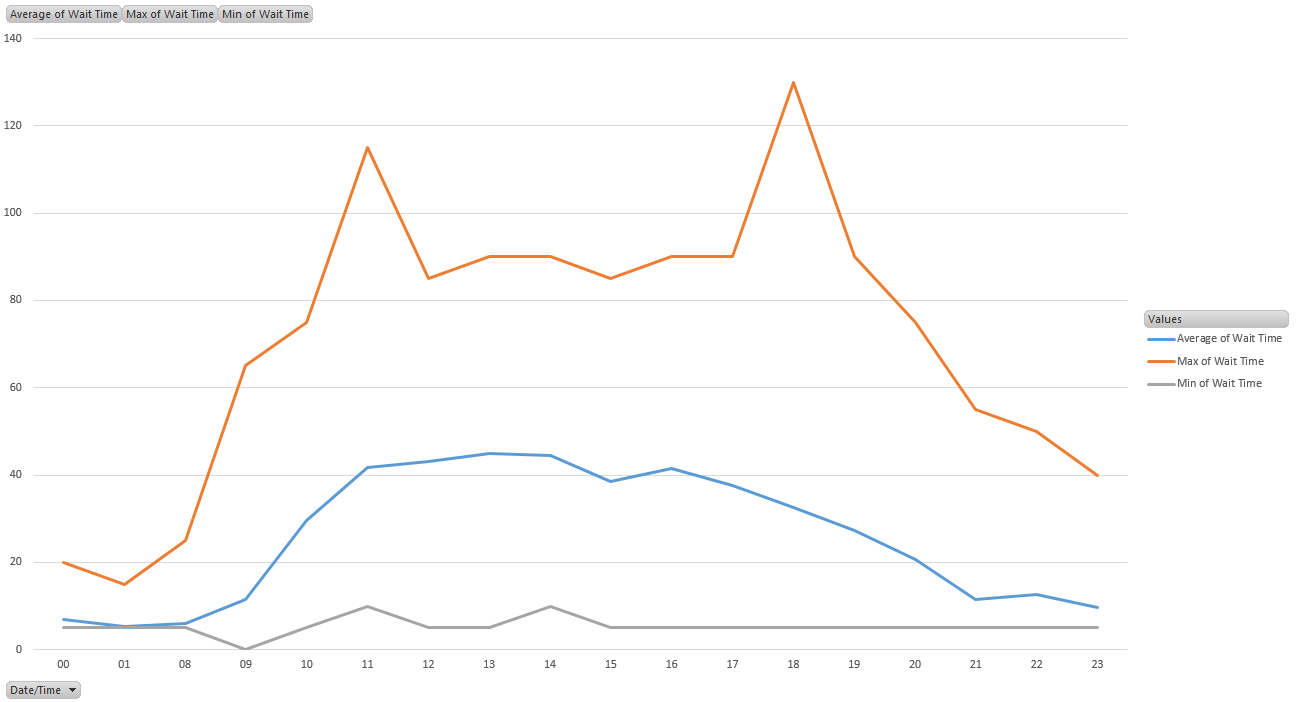
As you can see, it is always possible for the ride to be a 5 minute wait (although this could be because it has just come out of maintenance following a breakdown). Interestingly enough though, the queue has spiked to roughly 2 hours only twice: once at 11:00, and once at 19:00. Otherwise, the maximum wait time of around 90 minutes seems to stand from about 11:00 until 20:00.
Step 4: Profit
There is clearly a lot of fun to be had figuring out the optimal times to get in line for rides. It is no surprise that the lines are much shorter outside of the core park opening hours, so if you can take advantage of these extra hours, make sure you prioritise the big rides.
I plotted a bunch of other rides and found very similar results across the board. There being a dip around 15:00, leading to a gentle decline for the rest of the afternoon into the evening.
If you want to maximise your FastPass usage with this information, make sure you get FastPass return times for rides either first thing (so you can get additional FastPasses once you've used it up), or focus around the middle of the day, when the queues are significantly longer than other times.
This is my first basic attempt at looking at some Disney wait time data, and hopefully can begin to deploy some more advanced analysis in the future with a more real-time nature.